Same name, different bird
Some thoughts on the varieties of “data scientist”.
Originally posted to bayesball.blogspot.com, 2019-06-02
What do we mean when we see a bird and say that it’s a robin? A simple description would be a small brownish bird with a red breast. But that’s a superficial description, and when we say “robin” what we mean depends on your location; you don’t have to look very closely to see that the European and American robins are fundamentally different.

© Francis C. Franklin / CC BY-SA 3.0, Link
The European robin (Erithacus rubecula, pictured above) is an Old World flycatcher, catching insects on the wing.
The American robin (Turdus migratorius, below) is a thrush, and eats earthworms and other invertebrates, along with fruits and berries.
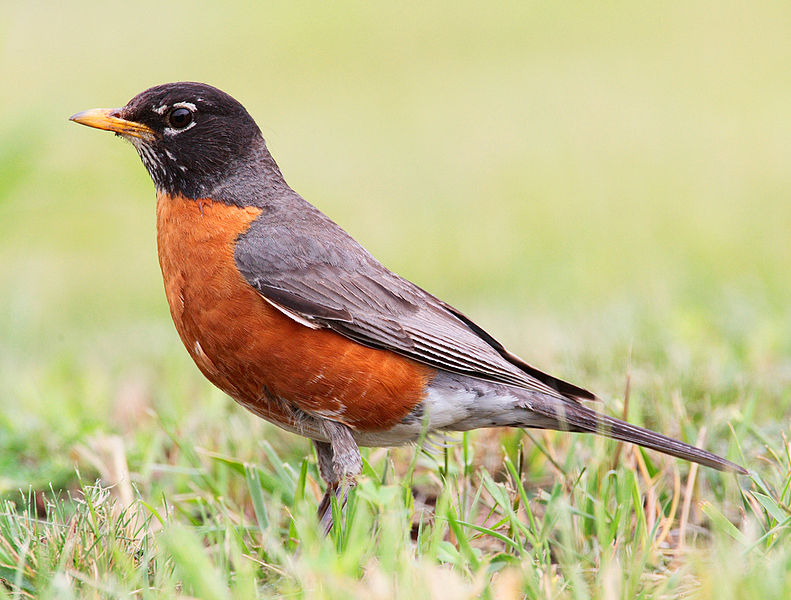
(The naming of the American robin is a classic case of “The Captain’s Hat”; European explorers and colonists arriving in other parts of the world and naming things in a way that reflected their existing knowledge and preconceptions.)
Similarly, what do we mean when we say “data scientist”?
Here’s a tweet by JD Long:
Why does data science exist as “a thing”? I postulate: the transaction costs of getting stats, biz, & dev people working together outweigh the gains from specialization. This has been wildly misunderstood by management consultants who fetishize gains from specialization. — JD Long (@CMastication) (2019-05-09)
The second tweet in his thread was the one that caught my attention:
Data Science got initial traction inside of small firms & startups that needed fast iteration & could not support specialists in data, stats, hacking & biz. They grew up this hybrid that combines domains and doesn’t specialize. In large orgs there becomes friction w specialists. — JD Long (@CMastication) (2019-05-09)
A reply in the thread linked to Eric Colson’s paper at HBR (2019-03-08), Why Data Science Teams Need Generalists, Not Specialists, which provides a compelling argument that the generalist data scientist provides significant value to the organization, particularly small organizations.
Explicit in both Long and Colson’s statements is that there are two different types of data scientists: the generalist and the specialist.
I want to go further in refining this typology, and postulate (based on my own anecdotal observations) some of the differences between the two.
Generalists
Generalists can be found, as JD Long has noted, in smaller organizations.
The academic backgrounds of data scientists tend to be Statistics (as a discipline), or they are people with a quantitative bent from (for want of a better term) subject matter disciplines, such as Astronomy, Economics, Geography, and Psychology.
This tends to position them smack dab in the middle of Drew Conway’s famous Data Science Venn diagram:
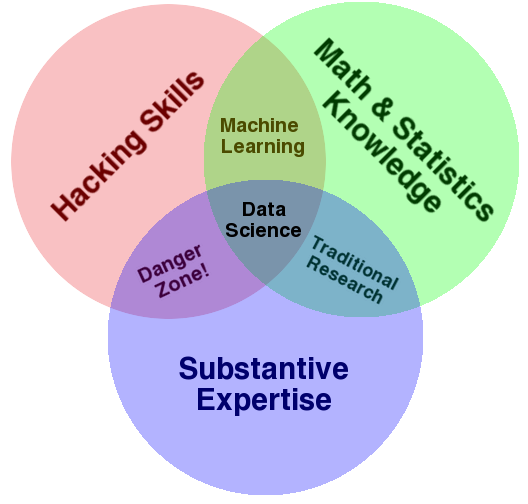
These generalist data scientists bring subject matter expertise, foundational statistical knowledge, and some pragmatic programming skills.
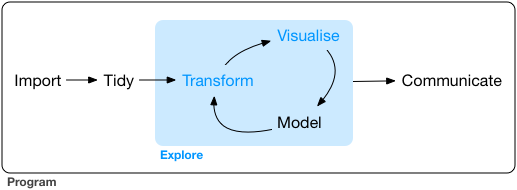
The work of the generalist tends to follow the full sequence of a typical data science project as envisioned by Grolemund and Wickham in R for Data Science:
I would go further, and argue that data scientists can (and perhaps should!) be involved earlier in the process, providing insights and expertise to the framing of the research question and the data collection phase. I am supported in this way of thinking by Stephanie Hicks and Roger Peng, whose recent paper “Elements and Principles of Data Analysis” (2019-03-18) includes the following definition of data science:
Data science is the science and design of (1) actively creating a question to investigate a hypothesis with data, (2) connecting that question with the collection of appropriate data and the application of appropriate methods, algorithms, computational tools or languages in a data analysis, and (3) communicating and making decisions based on new or already established knowledge derived from the data and data analysis. (p.2)
And following this line of thinking, I have observed that generalist data scientists tend to favour R as their tool of choice. Roger Peng (a biostatistician) has said “The R programming language has become the de facto programming language for data science.” R was developed first as a programming environment in which to do statistics, so many of the defaults and behaviours are optimized around how statisticians and subject-matter practitioners tend to think about their data analysis problem.
R’s foundational data structures are mathematical and statistical in nature: vectors, matricies, and data frames. As well, base R has a plethora of statistical functionality built in–for example, t tests, regression models, and statistical distributions.
Specialists
The specialist data scientist is a different creature. They tend to have a degree in Computer Science or Computational Statistics, often at the graduate level. In Drew Conway’s Venn diagram, they tend to be very deep on the “hacking skills”, with less emphasis on the statistics (as a discipline) or subject matter expertise.
Their work seems to fall largely on the “exploration” phases, with a strong emphasis on the “modeling” part of the data science process. They work with tidy, pre-processed data, often as part of an automated data processing flow from collection through analysis and modeling, to communication (which might also included automated feedback to points earlier in the process).
Because of their computer science backgrounds, these data scientists, in general, favour Python as their programming environment of choice. Python is a programming language first, to which data analytics packages (such as the {pandas} data analysis package) has been added.
Roger Peng and Hilary Parker touch on these differences in their podcast Not So Standard Deviations 81. Their nomenclature uses “statistician” for what I’ve called “generalist”, and “data scientist” for “specialist”. Starting at 25’ 00” through 30’ 00”, they first discuss sampling and how that’s not something that a specialist would think about (supporting my contention that the specialist emphasis is not on tried-and-true statistical methods). Peng summarizes the “data science mindset” regarding sampling as follows:
If I use all the data then I’m doing Big Data, but if I’m sampling then I’m just a Statistician.
Hilary Parker adds another dimension to the typology:
Data scientists working in tech…are really quick to say “I need to spin up this infrastructure to do this”; (they ask) “What big data tool can deal with this problem?”, rather than (what a statistician might ask) “Does the confidence interval really need to be this small for this application?” And (for specialists) there’s a certain joy with building out the infrastructure.
Kareem Carr goes further, and parses what I’ve described as a dichotomy into four separate categories:
Big data: Create huge datasets. Insights will be obvious!
— 🔥Kareem Carr🔥 (@kareem_carr) May 25, 2019
Data science: Play with data. Visualize it. Insights will be obvious!
Machine learning: Feed data into cool algorithms. Insights will be obvious!
Statistics: The insights will never obvious.#epitwitter #statstwitter
If I am interpreting this correctly, in my typology the “big data” and “machine learning” are part of the specialist group, and “data science” and “statistics” are generalists.
Summary
| Characteristic | Generalist | Specialist |
|---|---|---|
| academic background | Statistics, social science, physical science | Computer Science, Computer Engineering, Computational Statistics |
| Venn diagram emphasis | subject matter, statistics | hacking |
| Data science project | start-to-finish | exploration |
| language | R | Python |
The view from a small organization
I work in a small data analytics organization, and lead a crack team of data scientists. We all fit the “generalist” typology–although computer science courses have been part of our training, we don’t hold degrees in that area.
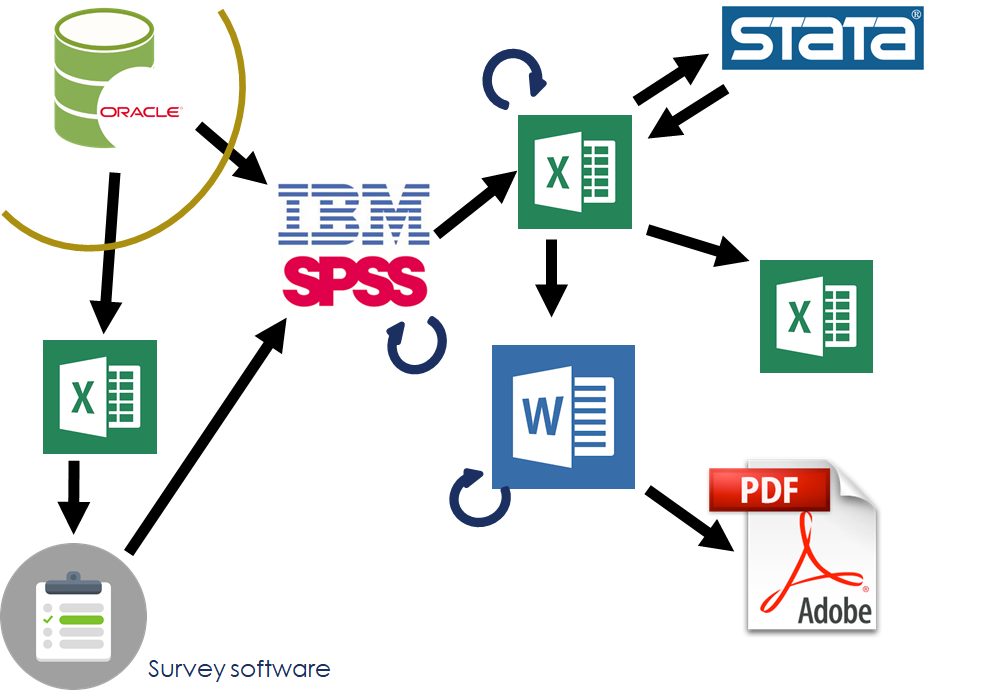
An example of our workflow can be shown in the example of an employee survey that we conduct. Our process used to look like this:
 source: modified from Andy Teucher and Stephanie Hazlitt
Data was extracted from the human resources database; we relied on database administrators from outside our organization to do this for us. This data was the basis of the survey frame, which was used in our survey software to administer the survey; the survey data then flowed into SPSS, where it was joined with demographic values pulled from the HR database. Manipulation and modelling occured in three programs: SPSS, Excel, and Stata.
The reporting to the clients was in the form of summary tables in Excel, along with PDF versions of documents written in Word. It’s worth noting that programmers outside the organization were responsible for automating the production of these Excel and PDF outputs, which have consistent structure and vary only by department.
Now it looks like this:
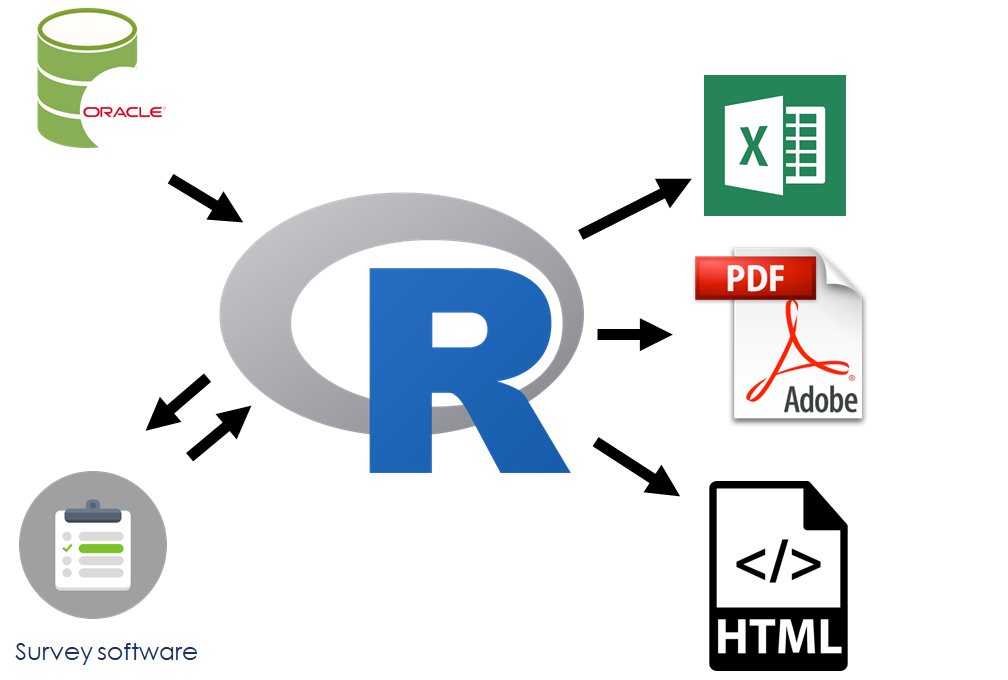 source: modified from Andy Teucher and Stephanie Hazlitt
The data scientists in our organization can write (in R) code that pulls the extract from the database which is used for the survey frame. They deploy the survey to collect the data, and then use R to wrangle and model the survey data–work that was done in a variety of other tools. The data scientists have also written R code, and creates a variety of outputs including Excel (using the {xlsx} package), PDF, and (coming soon) web-based reports (using Shiny).
In a large organization, the pin factory efficiencies would have led to specialization at every step of this workflow, but in our small shop, it’s extremely beneficial, as JD Long noted, to reduce the transaction costs. It’s certainly working for us; reducing our reliance and interactions with specialized IT resources (i.e. our transaction costs) has improved our efficiencies.
A biased view
There is significant bias in the Euro- and North American-centric definition of what defines a “robin”. But my view of what defines a “data scientist” might also be too narrow, in the same way that there is a Japanese robin and a Siberian blue robin (below).

-30-